title: Pollster slant vs customer mix status: superseded by AN-017 / AN-018 (2026-06-02)
Pollster slant vs customer mix
Test of the reputation-equilibrium theory in docs/theory.md §
"Pollster reputation: volume vs customer mix": per-pollster β
should be increasing in the firm's share of candidate-sponsored
polls and decreasing in their share of media-sponsored polls.
Update (2026-06-02). The first-pass test below (11 institutes from AN-007) was extended to 31 firms in AN-017; AN-018 then showed firm size dominates customer mix. On the 31-firm sample, customer-share is still positively signed (γ = +7.6 unweighted / +4.3 WLS) but explains < 5% of β variance (p = 0.27 / 0.54). Log firm volume gives δ = −4.28 unweighted (p = 0.017, R² = 0.18) and δ = −5.74 WLS (p = 0.0005, R² = 0.35); joint regression keeps size significant (δ = −7.09, p = 0.0002, R² = 0.40) and drops customer- share to p = 0.13. Monotone tertile split: small firms (n_total median ~13) β = +11.98; medium (~41) β = +8.64; large (~118) β = −0.93. The IIP/Census high-volume / near-zero-β cluster identified in the original scatter below was the volume-discipline mechanism showing through, not a customer-mix-sorting failure. Theory.md § "Pollster reputation" has been rewritten to lead with volume; customer-mix sorting is now the secondary refinement.
The original first-pass test is preserved below for historical context.
Method
For each of the 462 distinct pollster institutes in the 2024 mayoral sample, classify their polls into customer categories:
- candidate — any sponsor classified as committee_prefeito / committee_vice / party / party_name / individual (CPF)
- media_only — all sponsors are media outlets (no pollster_self, no candidate-linked)
- pollster_self_only — the firm sponsored its own poll (own marketing)
- mixed_indep — combinations of media + pollster_self
- other — residual (other_firm classifications)
Join with build/table/per_pollster_beta.csv (the per-pollster β
from the heterogeneity battery). Restrict to institutes with ≥5
self-sponsored polls AND non-degenerate cluster-robust SE
(SE > 0.1) — leaves 11 institutes.
Regress: β = α + γ · candidate_share + ε.
Results
| Spec | Slope γ | SE | p | R² | n |
|---|---|---|---|---|---|
| OLS (unweighted) | +13.58 | 15.39 | 0.40 | 0.08 | 11 |
| WLS (weighted by n_self) | +6.28 | 8.34 | 0.47 | 0.06 | 11 |
Both slopes have the predicted positive sign, but neither is statistically significant. n=11 is too thin for a sharp test.
Auxiliary specs:
| Spec | Coefficient | SE | p |
|---|---|---|---|
| β ~ media_share | γ_m = -17.50 | 13.52 | 0.27 |
| β ~ pollster_self_share | γ_p = -22.16 | 16.80 | 0.18 |
Both negative, as the theory predicts (more media → less slant). Still underpowered.
Scatter
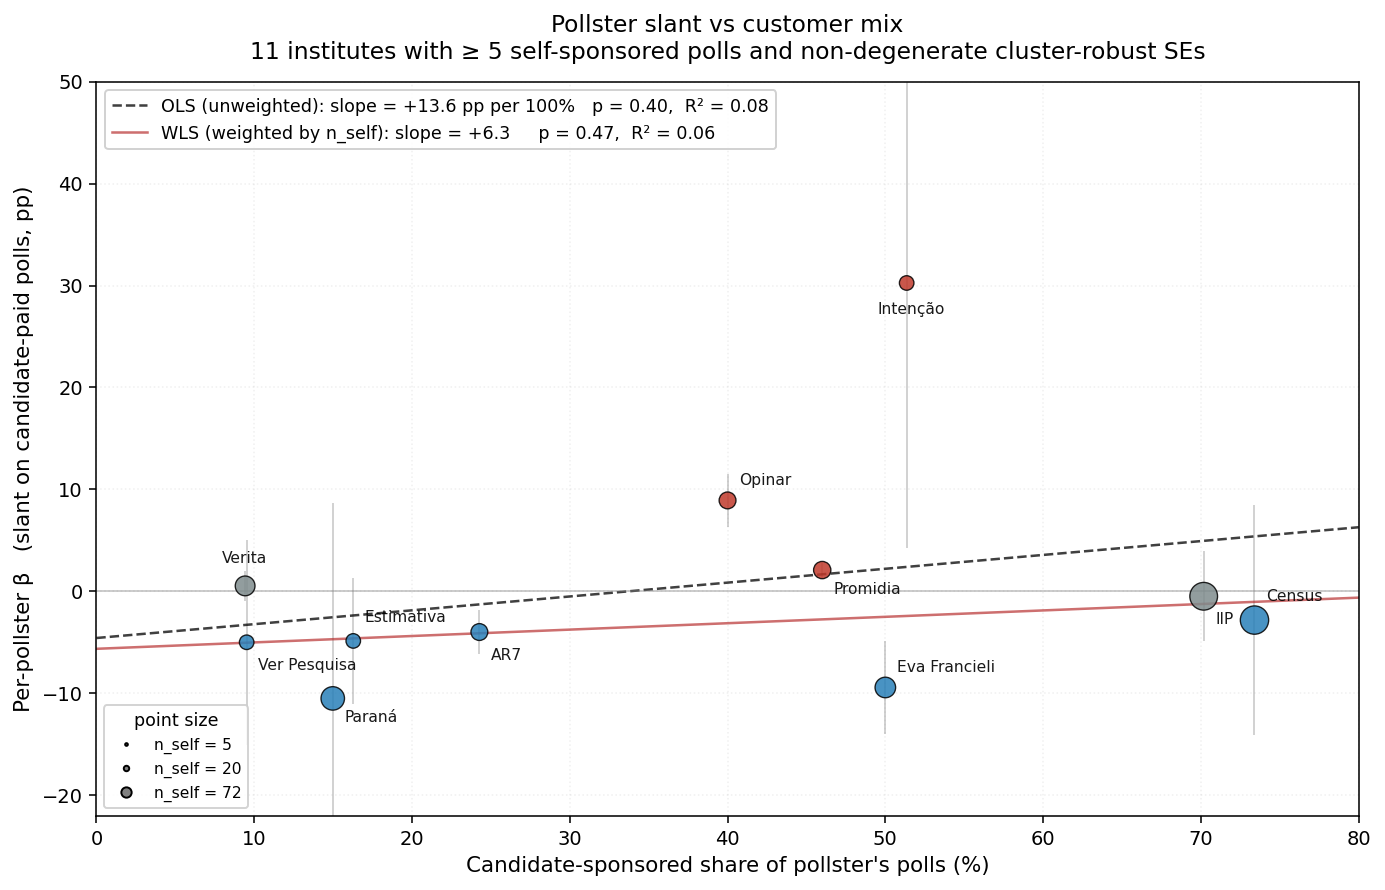
The visual picture qualitatively supports the theory at the low-end of candidate-share but breaks down at the high-end:
- Low candidate-share (≤25%): Verita (+0.5), Ver Pesquisa (-5.0), Paraná (-10.5), Estimativa (-4.9), AR7 (-4.0). All low or negative β.
- Mid candidate-share (25-50%): Mendonça (+4.7), Gerais (+3.0), Opinar (+8.9), Promidia (+2.1), Eva Francieli (-9.4). Mostly positive. Eva Francieli is the high-share-mid-region outlier with large negative β.
- High candidate-share (≥50%): Intenção (+30.3) is a small-n outlier (n_self=5). IIP (-0.5, n_self=66) and Census (-2.8, n_self=72) — the two highest-volume firms in the sample — sit near zero, contradicting the strict monotone prediction.
The IIP/Census pattern at the high end is the most interesting empirical finding. It's consistent with one of the theory's secondary predictions: high-volume firms are more disciplined than low-volume ones, because more reputation is at stake. IIP (412 polls) and Census (263 polls) have larger reputation investments to protect than the smaller mid-volume pollsters showing larger β.
Interpretation
Direction is right; magnitude is plausible (a 100-point candidate- share difference predicts a 6-14 pp difference in β, comparable to the headline β = +8). But the test is underpowered — 11 institutes is too few to discriminate the slope from zero.
The bimodality prediction (firms cluster toward poles, not the middle) is harder to test with this n but doesn't obviously hold in the scatter — there are institutes at every share level.
Caveats
- n=11 is thin. A more robust test would relax the ≥5 self-sponsored threshold and use a different per-pollster estimator (e.g., shrunken random-effects β) that doesn't rely on within-pollster candidate FE — which is what causes the degenerate-SE problem for small-cell firms.
- Endogeneity of pollster choice. Sponsors select pollsters based on expected slant. The cross-sectional regression identifies the equilibrium relationship, not a causal effect of customer mix on β.
- Volume confound. Customer mix correlates with firm volume. The high-share / low-β finding (IIP, Census) might be a volume effect — large firms have more to lose — rather than a customer- mix effect per se. The bivariate scatter can't distinguish.
- Per-pollster β is itself noisy. Cluster-robust SEs at the race level inside small-pollster subsamples lose precision; some of the variation we're regressing on may be estimation noise.
Next steps (queued in todo)
- Run the same scatter for 2022 federal + 2020 municipal cycles to expand n.
- Try a hierarchical-shrunken estimator for per-pollster β to reduce the impact of estimation noise.
- Probe the volume-vs-customer-mix confound: include log(n_total) as a control in the slope regression once n is large enough.
Reproduce
# In /workspace/projects/poll-sponsor-bias:
python source/analysis/heterogeneity.py            # produces per_pollster_beta.csv
python source/analysis/pollster_customer_mix.py    # first-pass: 11-institute slope + figure
python source/analysis/an-017-customer-mix-refresh.py   # 31-firm refresh (γ on candidate-share)
python source/analysis/an-018-firm-size-discipline.py   # log(n_total) discipline; supersedes